SEMICONDUCTOR RESEARCH FAB CUSTOM APPLICATIONS SAMPLER
- Most of these had some form of Excel, Excel charts, Excel VBA, and database access via ODBC.
- Webpages were implemented on an IIS server using PHP, and (of course) html, css, and javascript. Perl was used to bridge between Excel csv file output and webpage html (etc.) creation.
| Problem | Implementation Notes | Sample Screenshots (Just click on any screenshot for a bigger picture) | |||
| Consolidate misc Excel workbooks and sheets that were floating around. |
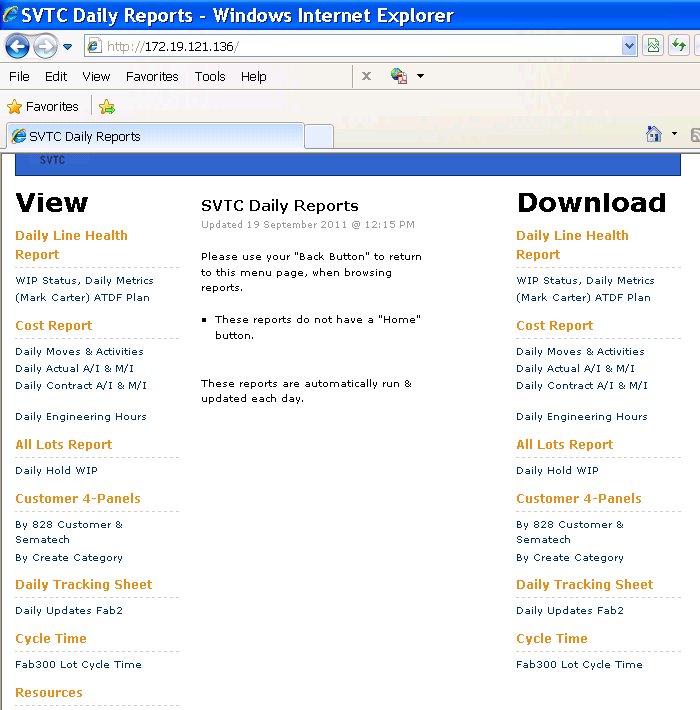
As part of automatically populating spreadsheets from database and web page scrapings, a "reports server" was setup, with both quick html views and Excel downloads.
|
This main menu grew mch bigger over 1 1/2 years, and came to include historical machine data and many more reports.
|
Various "jobs" (in Excel VBA or Perl) were kicked off via Windows Task Manager 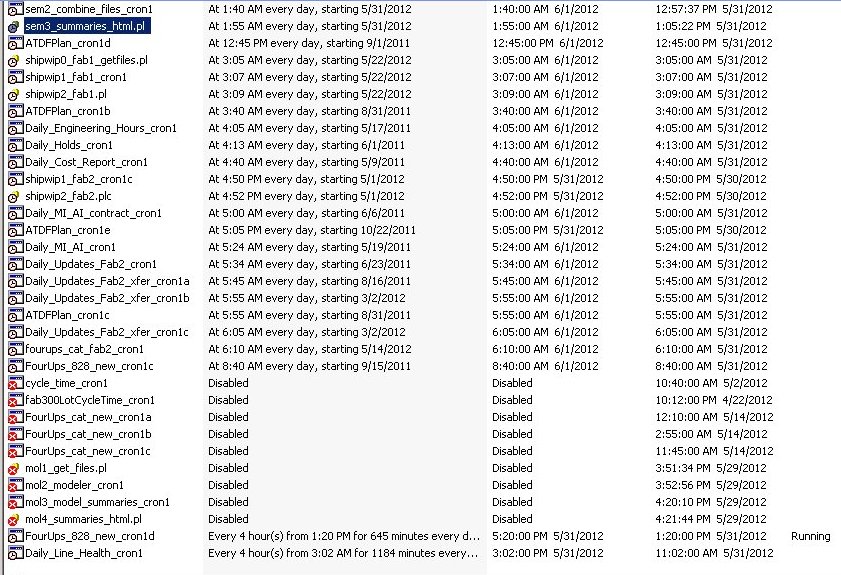 |
There were many automatically generated Excel reports and charts (per fab, per customer, per line of business, per revenue category) that were developed and are not shown. Moves, activities and active wip levels were plotted against targets. These targets were updated quarterly. |
|
| Which down tools have priority? |
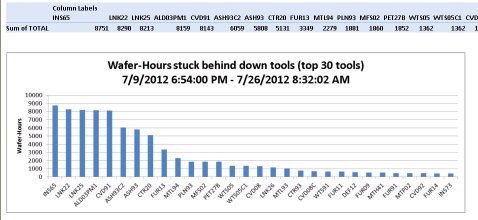
Production fabs have a more constant loading, meaning that standard measurements such as mean time to failure and hours down are indicative of tool status. Owing to route flows that go hot and cold over time, a research fab can have down tools with no overall effect on fab performance. What matters is to measure the wip (work in progress) buildup behind down tools. This was done in terms of polling & tracking "wafer-hours" behind down tools. |
 |
 |
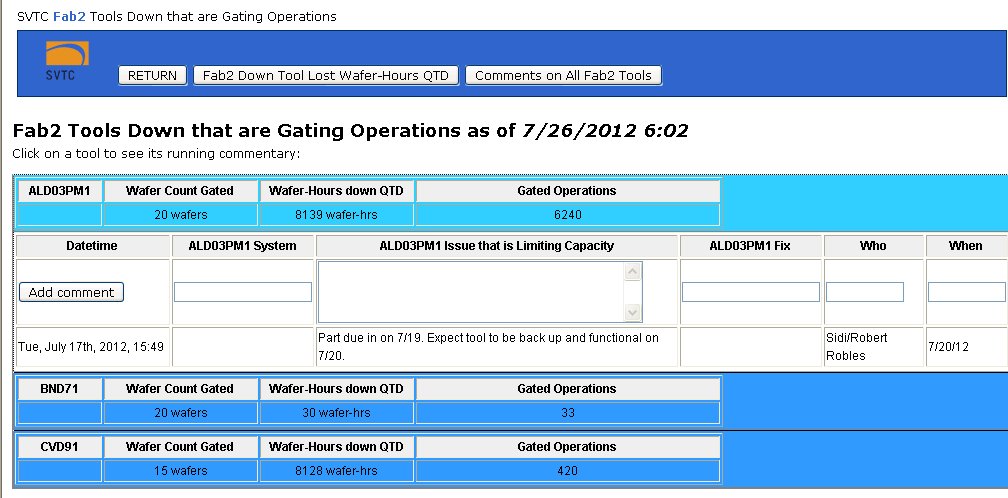 |
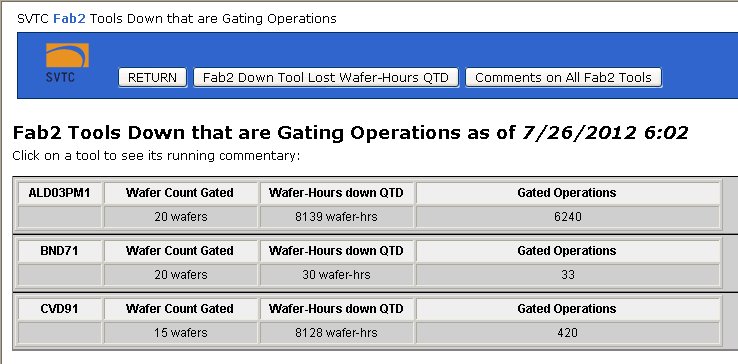
Polling and tracking which tools were truely gating wip (with no alternative tools available) was not trivial. 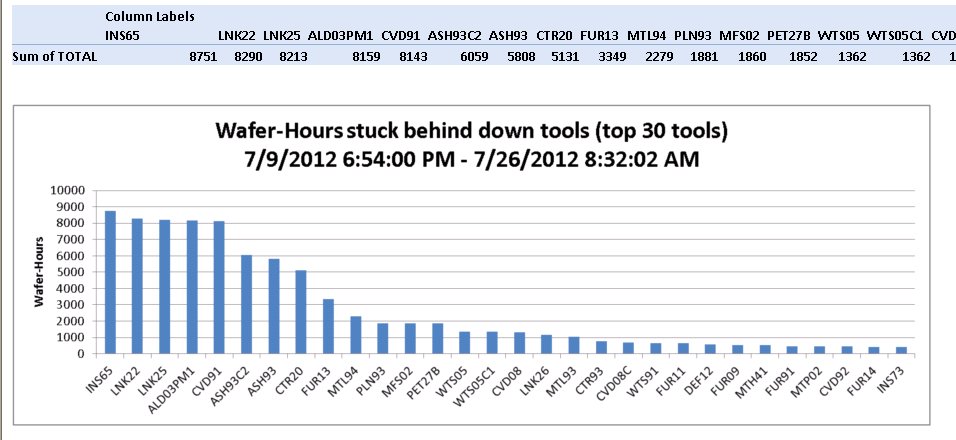 |
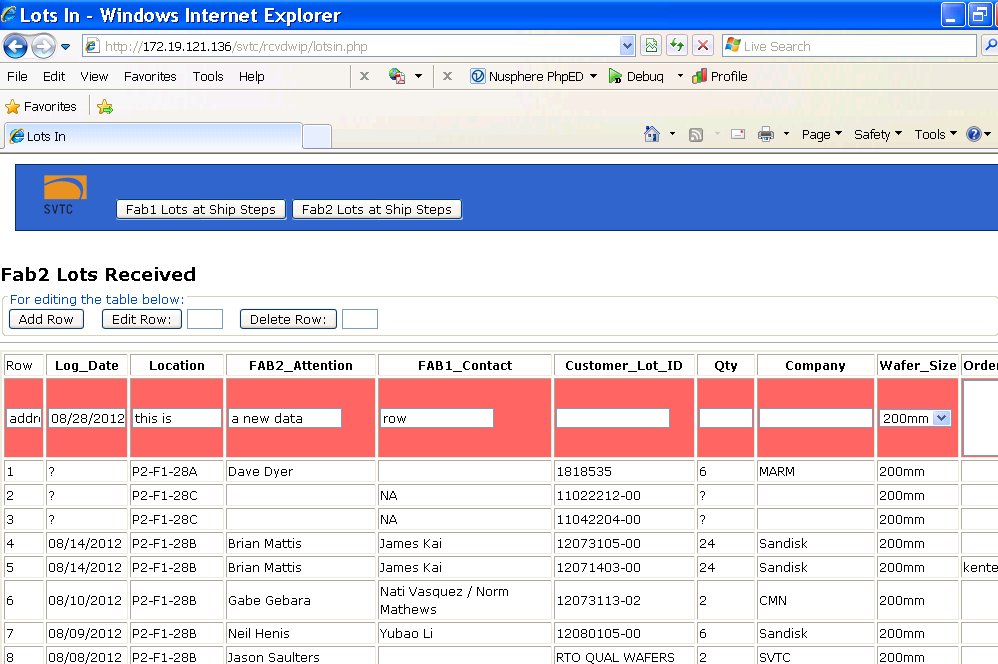
Which lots are ready to ship? Which lots have shipped? Which lots have arrived? What is their shipment history? |
A reseach fab often ships lots offsite for other processing and customer evaluation, and often has them come back to pick up and continue. This web based system addressed where the lots were, and what was their shipment history. It automatically emailed engineers and customers when lots were ready to ship.
|
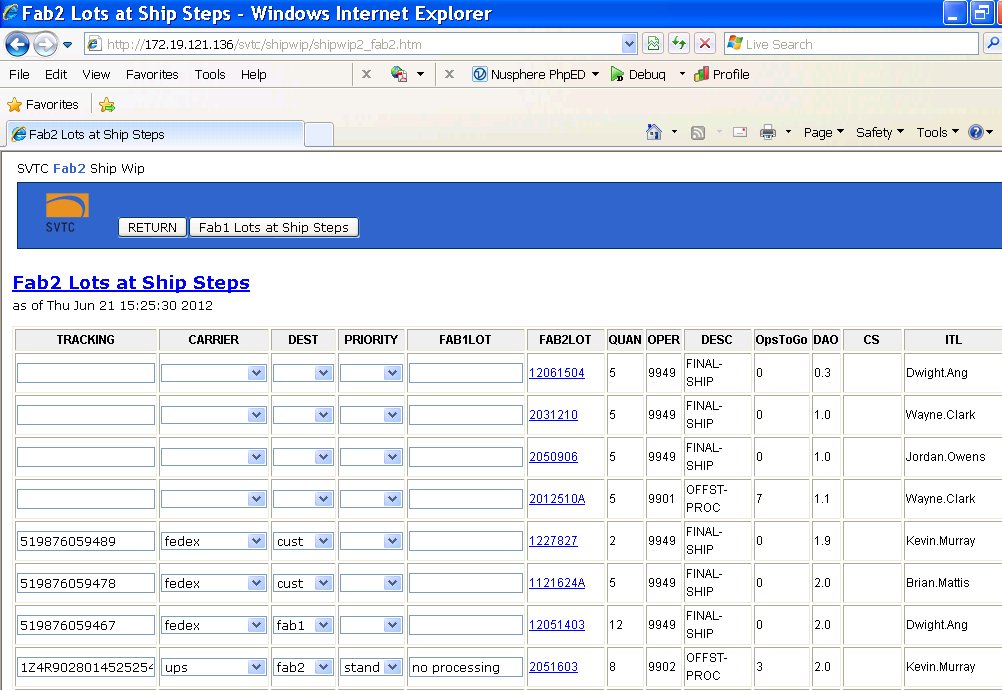 |
Various forms associated with shipping were accessible and stored with the web link for the lot.  |
 |
|
| Metrology OverLay (MOL) tool data collection |
Data existed on the tool in a software package called "RS1", which was a precursor to Excel. Learning the RS1 language to dig out the data, regressing overlay data to a least squares fit of the pattern according to documented vendor "models", and summarizing the whole thing on the web (with links to the original data and least squares fit calculations) was a challenge.
|
A webpage menu with links to the original data and summarized re-regressions.  |
A machine (RS1) screenshot. The numbers from this regression were not available for export, and had to be derived via re-regression. 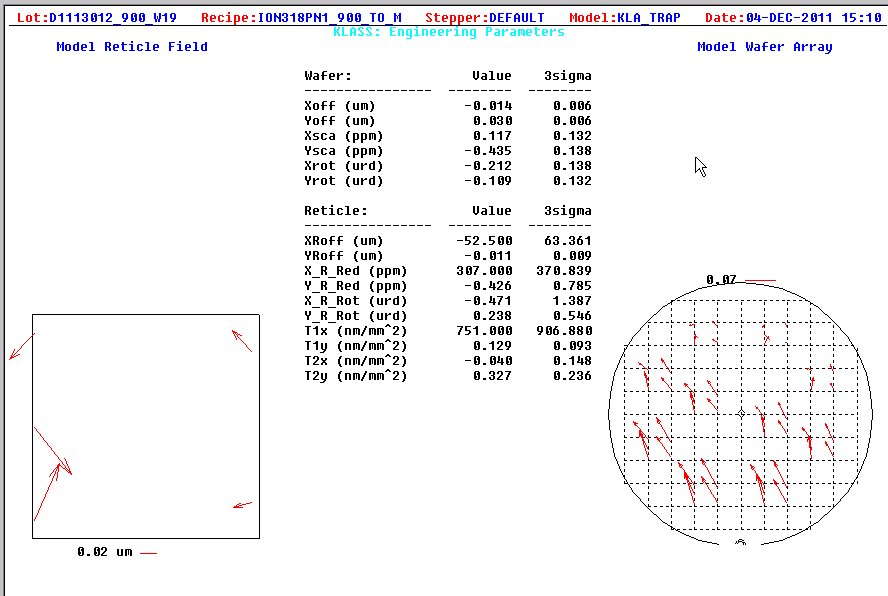 |
||
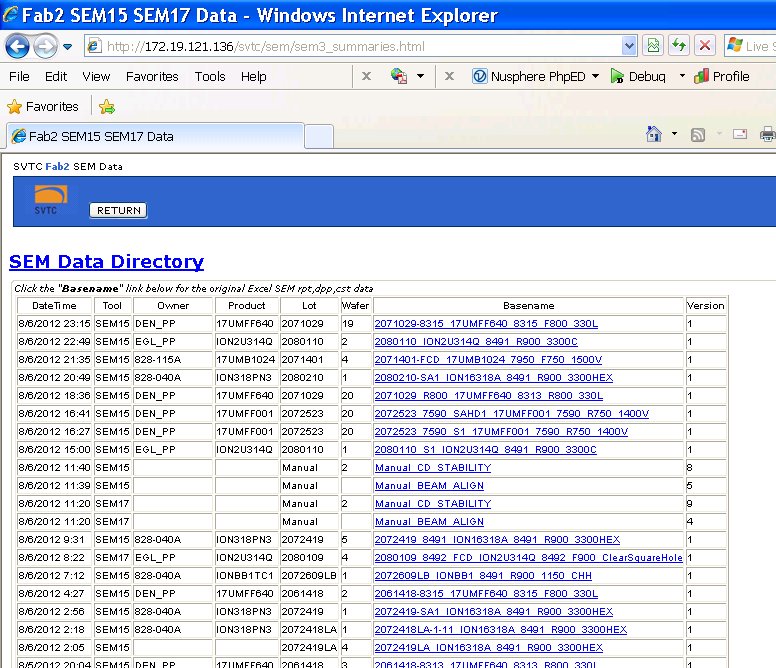
| Scanning Electron Microscope (SEM) data collection | Owing to disk mapping, this was a trivial project implemented with intelligent ftp (written in Perl) and webpage display of files uploaded (also written in Perl). |
 |
|||
| Sample user and design documentation | Report server setup and maintenance | Lot shipping and receiving online forms | Running comments on down tools gating wafers | Metrology overlay tool data collection | |